
ATLAS e-News
23 February 2011
Tricky taus
30 November 2010
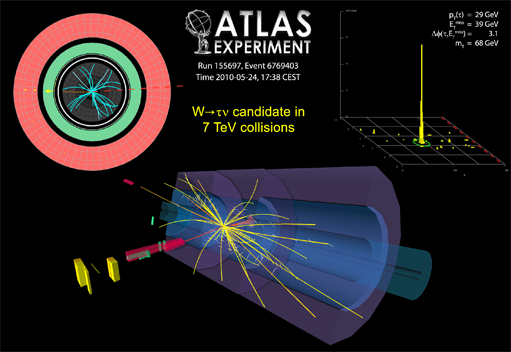
Event display showing a W decaying to a tau (seen in pink) and missing transverse energy.
Taus are notoriously elusive physics objects, difficult to catch hold of. Manifesting as either lookalike leptonic decays or as narrow, low track-multiplicity jets amidst an overwhelming sea of QCD jets, they're masters of disguise. A tiny team of ATLAS analysts spent the summer playing detectives, holed up in their offices on the trail of these slippery suspects, and we're pleased to report that their diligence paid off: In a conference note published on November 16 th, they announced the first observations of hadronically decaying taus in ATLAS.
“W's decaying to electrons and muons was one of the first analyses to be done, but Ws decaying to taus has only just been done now because it's so hard to understand how they look in the detector,” says Lidia Dell'Asta. She and her co-analysts had to employ a trio of tactics and a sizable dose of originality to zero in on their target.
The first step was to apply exactly the right trigger for their specific signal: A combined trigger that looked for taus and concurrent missing transverse energy. Once this had done its job selecting the data, then came the challenge of trying to prise apart the tau jets and the uninteresting QCD jets.
The usual cut that is applied to the 'missing Eτ' variable proved too weak to pick out a convincing sample. “It wasn't enough to be able to get the signal as we wanted it
the pollution from QCD jets was still too high,” Lidia explains. The solution to this particular obstacle arrived by chance, while she was having dinner with a colleague in Restaurant 1
Tommaso Lari has his fingers in many physics pies, making him a useful person to consult over stubborn plots. “He's a wonderful person because he always has the brightest ideas,” says Lidia. His idea was to apply a cut on a related variable missing Eτ significance which is routinely used in the SUSY analyses he works on. “I went back to my office, and it worked!” smiles Lidia.
The team were left with a sample with a much more favourable signal to background ratio, but they still needed to somehow siphon off the remaining QCD jets. Unfortunately the magic figure they needed the QCD jet production cross section, which would tell them how many QCD jets to expect in the remainder of their heavily-cut sample is not well known.
“It was impossible to extract the amount of QCD background for our analysis just from Monte Carlo simulations,” Lidia explains, “so what we had to do was extract it directly from data.” They looked at regions where they were sure they were only seeing QCD jets, then extracted the values they needed and backported these into the signal region of interest to find out how much QCD contamination they were dealing with.
In the end, the 78 events found in data lined up extremely well with the Monte Carlo predictions for the signal and background, added to the QCD backgrounds from data.
“The surprise was that we were actually really able to see the signal,” says Lidia. “It was unexpected; you just have a jet and missing Eτ, so it's very hard to see. It was amazing that we managed to find a way to get the signal.”
The realisation that results were emerging very quickly spurred the team on to spend the days, nights, and weekends of their summer indoors looking at computer screens. But it was worth it, says Lidia; the analysis only began in July, but their enthusiastic three-month turnaround was quick, and it will now form the main part of her thesis.
“I was thinking to have something about tau performance actually, but when we realised that we really could have an observation soon, we said OK, let's go for it.”
The teamwork, as well as the final result, was a major source of satisfaction for all those involved. Lidia and her supervisor, at CERN and Milano, a trio of collaborators in Bonn, and another in Yale, were each others' faithful virtual companions during the intense few months: “We were spread around the world, but in constant contact all day crosschecking numbers and keeping up with each others' progress,” she smiles. “It was really how a collaboration should be.”
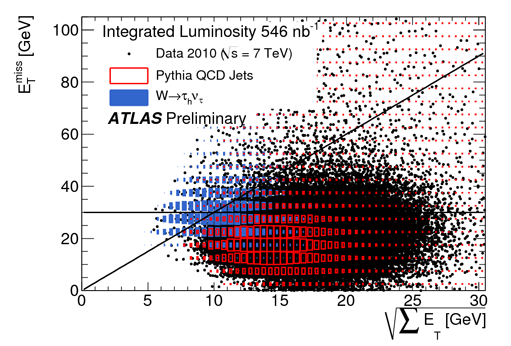
Plot showing the distribution of missing transverse energy as a function of a quantity proportional to its resolution for data, simulated signal and QCD background. The events selected by the analysis lie in the top left region of the plot.
 Ceri PerkinsATLAS e-News
|